VAoLM explorations
This is some rough exploratory work toward a system like I describe in my application essay, a visual analog of linguistic meaning. It is an attempt to visualize the ways that a given text differs from the predictions of an LLM, in the hope that patterns of difference will reflect something about the meaning of the text.
Technical detail
Each token of the input text is compared to the token that an LLM would have predicted at that spot. For example, in the phrase “an example of some text,” the word “some” gets compared to “a,” because when the LLM is given “an example of…”, it predicts the next word will be “a” rather than “some.” Then when the LLM is given “an example of some…”, it predicts the next word will be “of” rather than “text,” so “text” gets compared to “of,” and so on.
For each of these pairs of an actual token and a predicted token, the system calculates the difference between these two in the model’s embedding space. That difference vector is projected down to three dimensions to create a color: a difference of zero becomes gray, and the more a token differs from the prediction, the more different the color is from gray. Tokens that differ from the prediction in a similar way will have a similar hue and saturation.
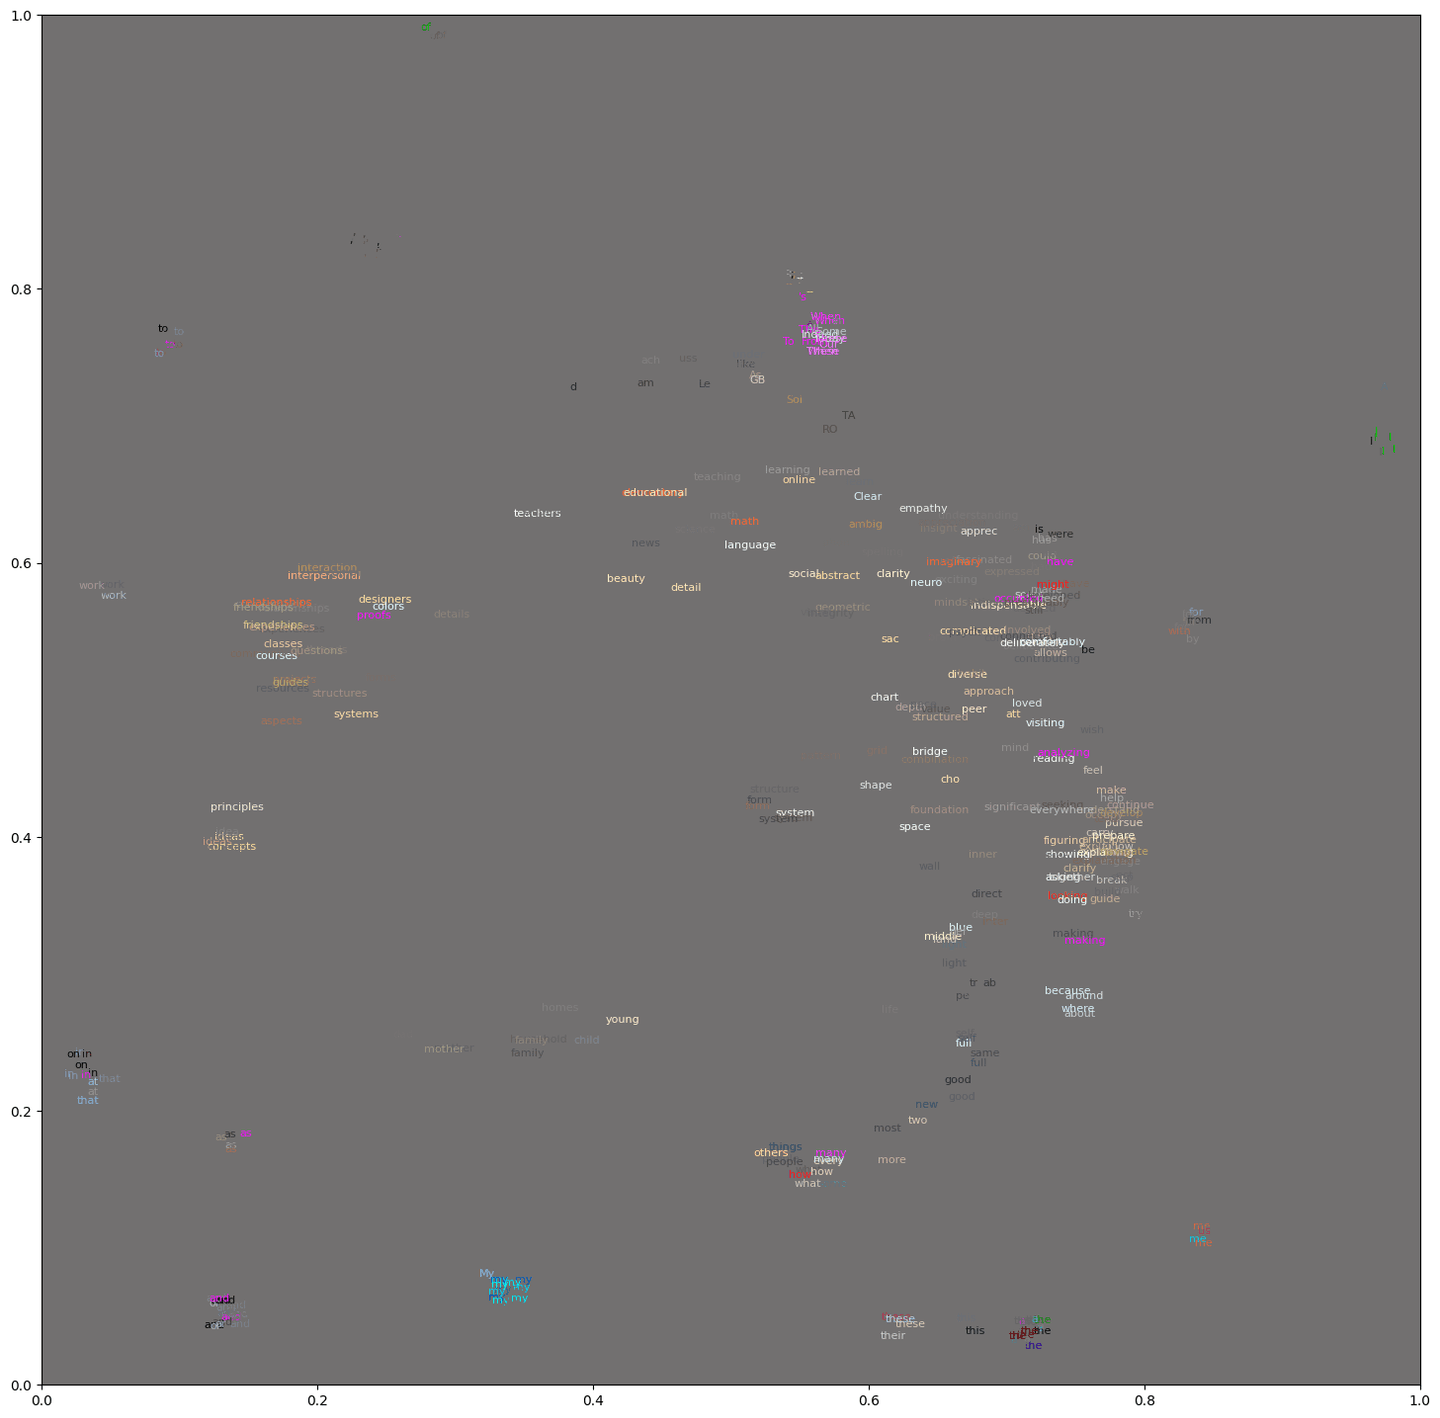
To make the visualization, the tokens with their associated colors are graphed on a two-dimensional projection of the embedding space. If several points near each other have similar colors, that indicates a cluster of tokens with similar meanings that differed from the predicted tokens in similar ways — which, in some cases, could indicate a pattern in the meaning of the text.
(In this image, however, such clusters mostly seem to be artifacts of English word order. For example, in most places an adjective shows up, there could also have been a noun at that spot: e.g. “the cat” vs. “the gray cat.” So I imagine that for many adjective tokens, the predicted token would usually be a noun, which means that the color of most adjectives would largely come from the difference between adjectives and nouns in general, rather than anything particular to the text. I have some ideas for how I might remove this component to focus on what is unique to a text.)
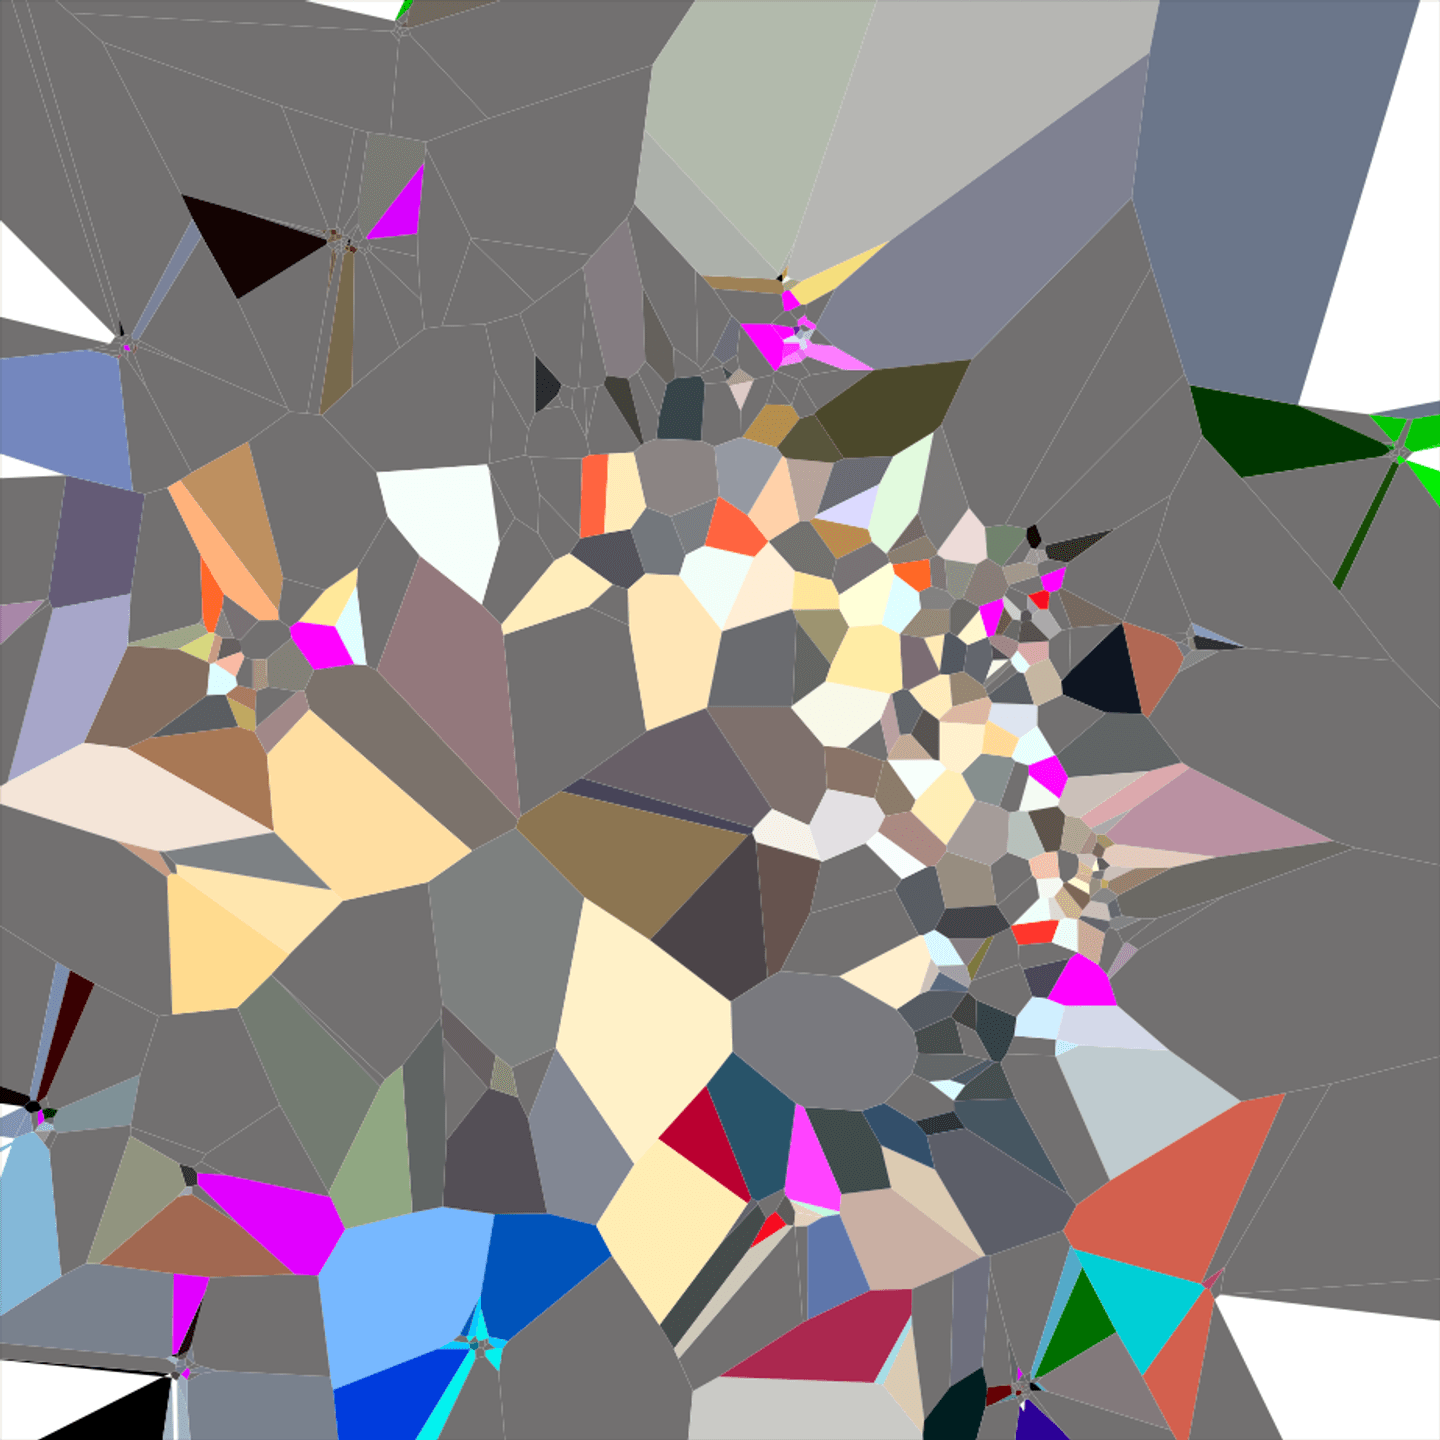
If I succeed in finding a way of making real patterns of meaning visible, I’ll then spend more time exploring how to visualize this data in a way that is more aesthetically interesting: ultimately I want it to look like abstract art rather than a graph. The Voronoi diagram version below is a small step in that direction.